

Every hour a critical asset is down has a price, and the repair bill is only part of it. Downtime costs reach into lost output, idle labor, overtime, expedited parts, scrap, and the delivery dates your customers are counting on. When you can put a number on each of those, you can decide where to direct your reliability budget and make the case for your choices in a capital review.
The good news is that your team already holds the levers to control that cost. Repairs cost less when they happen on your schedule: a bearing replaced during a planned stop, with parts staged and a technician lined up.
Key highlights:
- Downtime costs are the total financial impact of equipment stoppages, including lost production, labor, repairs, and secondary costs like scrap, expedited freight, and missed deliveries.
- To calculate the true downtime cost, total each event’s costs, divide by its duration for a cost per hour, and roll events up by asset to see which machines carry the most cost.
- Reducing the cost of downtime starts with a baseline and a criticality ranking, then shifts repairs from reactive fixes into planned maintenance windows.
- Downtime management solutions that pair continuous monitoring with prescriptive diagnostics and CMMS integration help teams turn early warnings into scheduled work and track the cost avoided.
What are downtime costs?
Downtime costs are the total financial impact of any period when equipment scheduled to run isn’t producing, including lost output, recovery costs, and effects on schedules and customers.
| Downtime cost type | What it includes | Where to find the number |
| Lost production | Output lost during the stoppage and while the line ramps back up | Production rates and margins |
| Labor | Wages for idled operators, repair labor, contractors, and overtime | Payroll and timekeeping records |
| Repairs | Replacement parts, expedited shipping, outside services, and damage to connected components | CMMS work orders and purchasing |
| Secondary costs | Scrap and rework, restart energy, contractual penalties, and orders lost to late delivery | Quality, energy, and customer records. |
| Hidden costs | Safety exposure, displaced planned work, and extra inventory held as a buffer against breakdowns | Hard to price; note them alongside your total |
Here’s how costly downtime eats into your production:
- Fixed costs keep running during a stoppage: Rent, depreciation, and salaried staff don’t pause when a line does, so each lost hour spreads the same overhead across fewer units.
- One stopped machine cascades downstream: When a bottleneck asset stops, upstream stations back up and downstream stations starve, so a single failed pump or gearbox can stop an entire line.
- Rushed restarts strain your workforce: Emergency repairs pull technicians off planned work, stretch shifts into overtime, and put people on equipment under time pressure.
- Late or missed shipments hurt your plant’s reputation: When customers measure suppliers against on-time, in-full delivery, a pattern of missed dates can put preferred-supplier status and future orders at risk.
Across U.S. discrete manufacturers, losses from preventable maintenance issues reached an estimated $119.1 billion in 2016, according to the National Institute of Standards and Technology (NIST), most of it from lost sales due to delays and defects. The pressure hasn’t eased: in MaintainX’s 2026 State of Industrial Maintenance report, 39% of maintenance and operations leaders said unplanned downtime events are getting more expensive, up from 31% in 2025. Your number will differ by industry, line, and product, which is why calculating your own matters more than any benchmark.
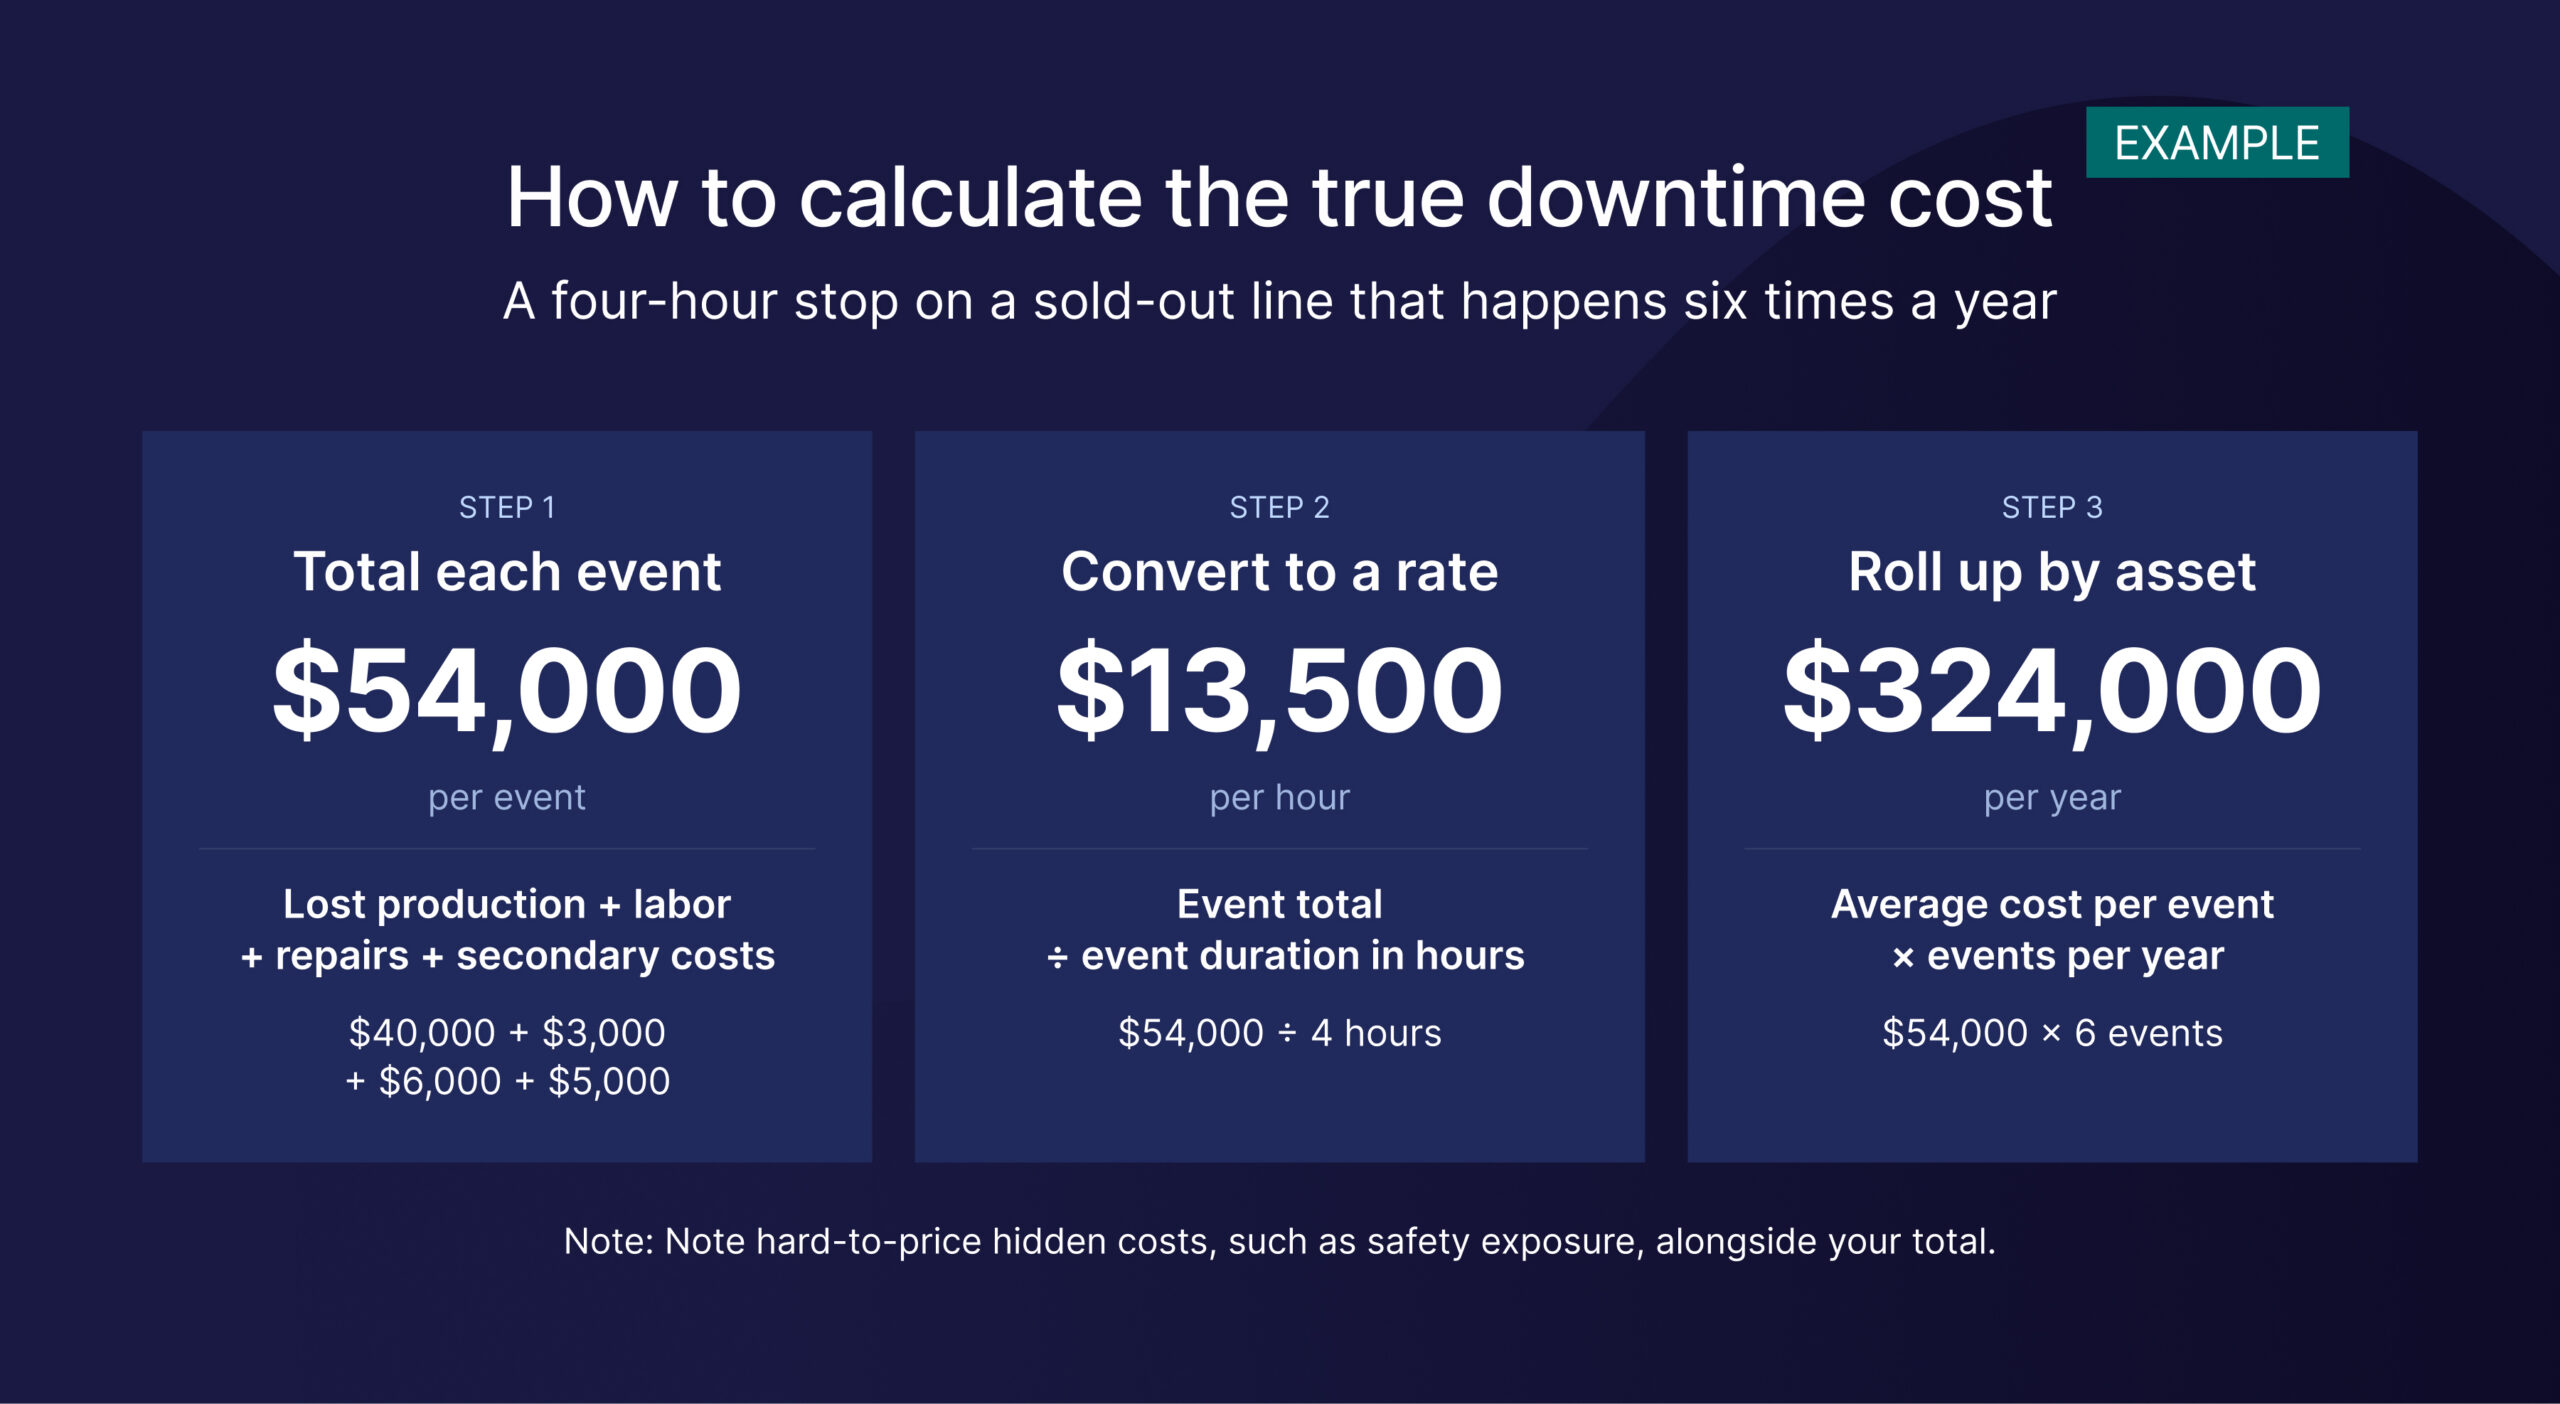
How to calculate the true downtime cost
True downtime cost is the sum of every cost tied to a stoppage, not just the repair bill. Calculate it per event first, then roll events up by asset and line so you can see which machines account for the most cost over a quarter or a year.
The sources in the table above cover most of the inputs. Where a figure is an estimate, note the assumption so finance can review it.
- Calculate lost production: Multiply downtime hours by the line’s hourly output, then by the contribution margin per unit. Contribution margin already reflects the fixed costs those units would have covered, so don’t add rent or depreciation separately. If you can make up the lost output later, skip lost margin and count the recovery cost, such as overtime, in step 2. Include the ramp-up period after restart, when the line runs below rate.
- Factor in labor costs: Add wages for operators idled by the stoppage, plus repair labor for technicians and contractors. Use the overtime rate for any hours worked outside the normal shift.
- Include repair costs: Add replacement parts, expedited shipping, rental equipment, outside service fees, and damage to connected components tied to the event.
- Capture secondary costs: Add scrap and rework from the interrupted run, restart energy, contractual penalties, and orders lost to late delivery.
- Calculate the total downtime cost: Total downtime cost = lost production + labor + repairs + secondary costs. Divide the total by the event’s duration for a downtime cost per hour you can apply to future events on the same asset.
For example, a four-hour stop on a sold-out line that produces 500 units per hour at a $20 contribution margin loses $40,000 in production. Add $3,000 in idle and repair labor, $6,000 in parts and expedited shipping, and $5,000 in scrap and rework, and the true downtime cost comes to $54,000, or $13,500 per hour. If that stop happens six times a year, the asset’s annual downtime cost is $324,000. Run the same math across your assets, and the ones with the highest annual figures are where to focus first.

How to reduce the cost of downtime
Once you know what downtime costs on each asset, you can decide where to act first. The aim is to reduce machine downtime where it costs the most and shift as much of the remaining repair work as possible into planned windows.
The six steps below run from measuring production losses to tracking the hours you recover. Steps three through five are where predictive maintenance in manufacturing does its work.
1. Baseline production downtime by asset and line
Pull your recent downtime history and break it out by asset and line. Use machine downtime tracking and analysis methods to capture start and end times, reason codes, lost units, and the downtime cost of every event. Pair the baseline with availability data so you can show how each hour you recover lifts availability, one of the three factors in improving OEE.
2. Rank assets by criticality and cost of failure
Not every machine needs the same level of attention. Score each asset on how much production it can take down, whether it’s a single point of failure, spare-parts lead time, safety exposure, and its annual cost of downtime from your calculation. Frameworks like reliability-centered maintenance (RCM) give this ranking structure. For inexpensive assets that fail rarely and swap out quickly, run-to-failure can be a deliberate, defensible choice.
3. Move critical assets to condition monitoring with IoT sensors
On the assets at the top of your ranking, reactive maintenance puts every repair on the machine’s schedule instead of yours. Condition-based monitoring tracks the actual health of each asset and triggers work when readings change, so your team steps in while a fault is developing rather than after a breakdown.
IoT sensors make that monitoring continuous, catching faults that develop between manual inspection routes. Vibration data reveals mechanical issues like imbalance, misalignment, looseness, and bearing wear. Temperature points to friction and lubrication problems, and magnetic flux adds visibility into a motor’s electrical condition.
A vibration monitoring system built on IoT predictive maintenance turns those signals into a running health record for each asset. When you compare predictive maintenance technologies, check coverage for your full asset mix, including slow-rotating equipment and machines in hazardous areas. Expand as the program proves its value.
4. Act on AI diagnostics before failures reach the line
Sensor data pays off when someone can interpret it quickly. AI diagnostics compare incoming signals against patterns from past failures to identify the likely fault, its severity, and the recommended fix, so technicians can stage parts and plan the job before they reach the machine. With an AI agent like the Reliability Agent, your team gets the evidence gathered, likely root causes identified, and a drafted analysis to review before deciding what to do.
5. Schedule repairs into planned maintenance windows
Early warning turns into savings when the repair lands in a window you choose. With lead time, planners can bundle the job with other work, confirm parts and crews, and fit it into a scheduled stop.
The team at Fiberon, part of Fortune Brands Innovations, put this into practice at its New London, North Carolina plant. After connecting 40 critical machines, the team received early signs of a melt pump failure and scheduled the repair during an already-planned shutdown, saving $56,000 with zero unplanned downtime. Over eight months, the site saved $274,000, avoided 178 hours of downtime, and achieved a 2.5x ROI.
6. Track recovered hours and cost avoided
Log what each catch was worth: the downtime hours you estimate were avoided, multiplied by that asset’s per-hour downtime cost. Total those each year and compare them against the annual cost of downtime you started with. Add the totals to your maintenance KPIs alongside your ratio of planned to unplanned work and mean time between failures. As major failures become rare, those trend lines keep the program’s value visible in quarters without a headline save. Energy use belongs in the tally too, since predictive maintenance cost savings can extend to healthier machines drawing less power.

What to look for in a downtime management solution for your facility
A downtime management solution should shorten the time between a developing fault and a scheduled repair. When you compare options, look past the dashboard: ask what the system does with a signal before your team sees it, and how easily its findings move into the systems your planners already use.
Use this checklist to compare predictive maintenance solutions on the capabilities and services that shape your downtime cost.
| Downtime management solution capabilities | Why it matters | What to evaluate |
| Continuous monitoring coverage | Developing faults get flagged early enough to plan the repair. | Asset types covered (standard rotating, slow-speed, hazardous areas), data types collected, installation requirements, and cost to extend coverage to lower-criticality assets |
| Prescriptive AI diagnostics | A named fault with a recommended action cuts diagnostic time and helps technicians arrive with the right parts | Whether alerts include fault type, severity, recommended action, and the supporting evidence |
| Analyst review of alerts | Expert review adds confidence on complex assets and helps reduce false alarms | Whether certified analysts review findings, which assets or service levels include review, and turnaround time |
| CMMS and EAM integration | Findings become work orders without re-keying | Available connectors for your CMMS or EAM, two-way status updates, and work order drafting |
| Multi-site scalability | Consistent data and reporting let you compare assets and share practices across plants | Centralized visibility across sites, deployment speed, and value reporting by site |
See how continuous monitoring and diagnostics work on your critical assets: request a demo.
Turn downtime cost into a number you control
You now have a way to put a dollar figure on every stoppage. The next step is scale: keeping that number current across every asset you monitor, catching developing faults while there’s still time to schedule the fix, and proving the value quarter after quarter without adding hours to your team’s week. That’s how reactive firefighting gives way to planned work, and how you minimize unplanned downtime on the assets that matter most.
You can take that step with Augury Reliability Expert, built on Augury’s Machine Health foundation. You get continuous monitoring matched to each asset’s criticality, plus AI-assisted Reliability Investigations that gather the evidence, rank bad actors, and draft the analysis for your team to review and decide on. Each failure you avoid shows up as production hours recovered and savings you can count.

Frequently asked questions
-
What is the difference between planned and unplanned manufacturing downtime?
The difference between planned and unplanned manufacturing downtime is whether the stop happens on your schedule. Planned downtime is scheduled in advance for maintenance, changeovers, inspections, or upgrades, with parts, crews, and production plans lined up ahead of time. Unplanned downtime happens without warning, often from an equipment failure, and forces your team to react. Unplanned stops typically cost more per hour because emergency labor, expedited parts, and schedule disruption add to lost output.
-
What is the cost of my annual maintenance shutdown?
The cost of your annual maintenance shutdown is the value of production lost during the outage plus everything spent to execute the work. To estimate your annual shutdown maintenance cost, add up:
- Lost contribution margin for the full outage, including ramp-down and restart, less any output you built ahead to cover it
- Internal labor, contractors, and overtime
- Parts, materials, and equipment rentals
- Planning, permitting, and safety preparation time
Condition data helps you scope shutdown work to what each asset needs, so crews spend less time opening healthy equipment and developing faults get addressed before the next outage. At Fiberon, the melt pump repair fit into a shutdown already on the calendar.
-
How much does downtime cost per hour?
Downtime costs around $25,000 per hour per facility on average, and more than $500,000 per hour for larger organizations, according to MaintainX’s 2024 State of Industrial Maintenance report. Your figure depends on your industry, line speed, and product value. To find it, add lost production, labor, repairs, and secondary costs for an event, then divide by the event’s duration.
-
How much can predictive maintenance reduce downtime costs?
Predictive maintenance can reduce downtime costs by lowering both the number of unplanned stops and the cost of each one. McKinsey reports that predictive maintenance typically reduces machine downtime by 30% to 50%, and Deloitte estimates it can increase uptime and availability by 10% to 20%.
In The Total Economic Impact™ Of Augury Machine And Process Health, a commissioned study conducted by Forrester Consulting on behalf of Augury (July 2025), a composite manufacturer with $20 billion in annual revenue saved $16.8 million over three years from reduced unplanned downtime and saw a 310% ROI with payback in less than six months. Your results will depend on asset criticality, coverage, and how consistently your team acts on alerts.